
Expert analysis – Technical Outlook & Geopolitical Update
Fundamentals continue to have a limited direct impact on TTF price action, while geopolitical developments remain the primary market driver
US strikes may pave the way for further escalation against Iran. The latest attacks targeted Iranian air defence systems, coastal radar sites, missile and drone launch positions, as well as smaller naval assets. According to a US official, these were “preparatory operations” designed to create the conditions for a more intensive military campaign.
Trump has still not revealed his next steps but has openly stated that, if necessary, the US could seize Kharg Island. He has also reiterated that the deeply buried Pickaxe Mountain nuclear facility remains a potential target.
Iran: Hormuz remains a “red line”. Tehran insists that the Strait of Hormuz will only reopen if the US fully complies with the 14-point agreement reached in June and accepts Iran’s maritime regulations. Analysts also warn that Iran’s Houthi allies in Yemen could attempt to disrupt or close the Bab el-Mandeb Strait, putting a second critical global energy shipping route at risk alongside Hormuz.
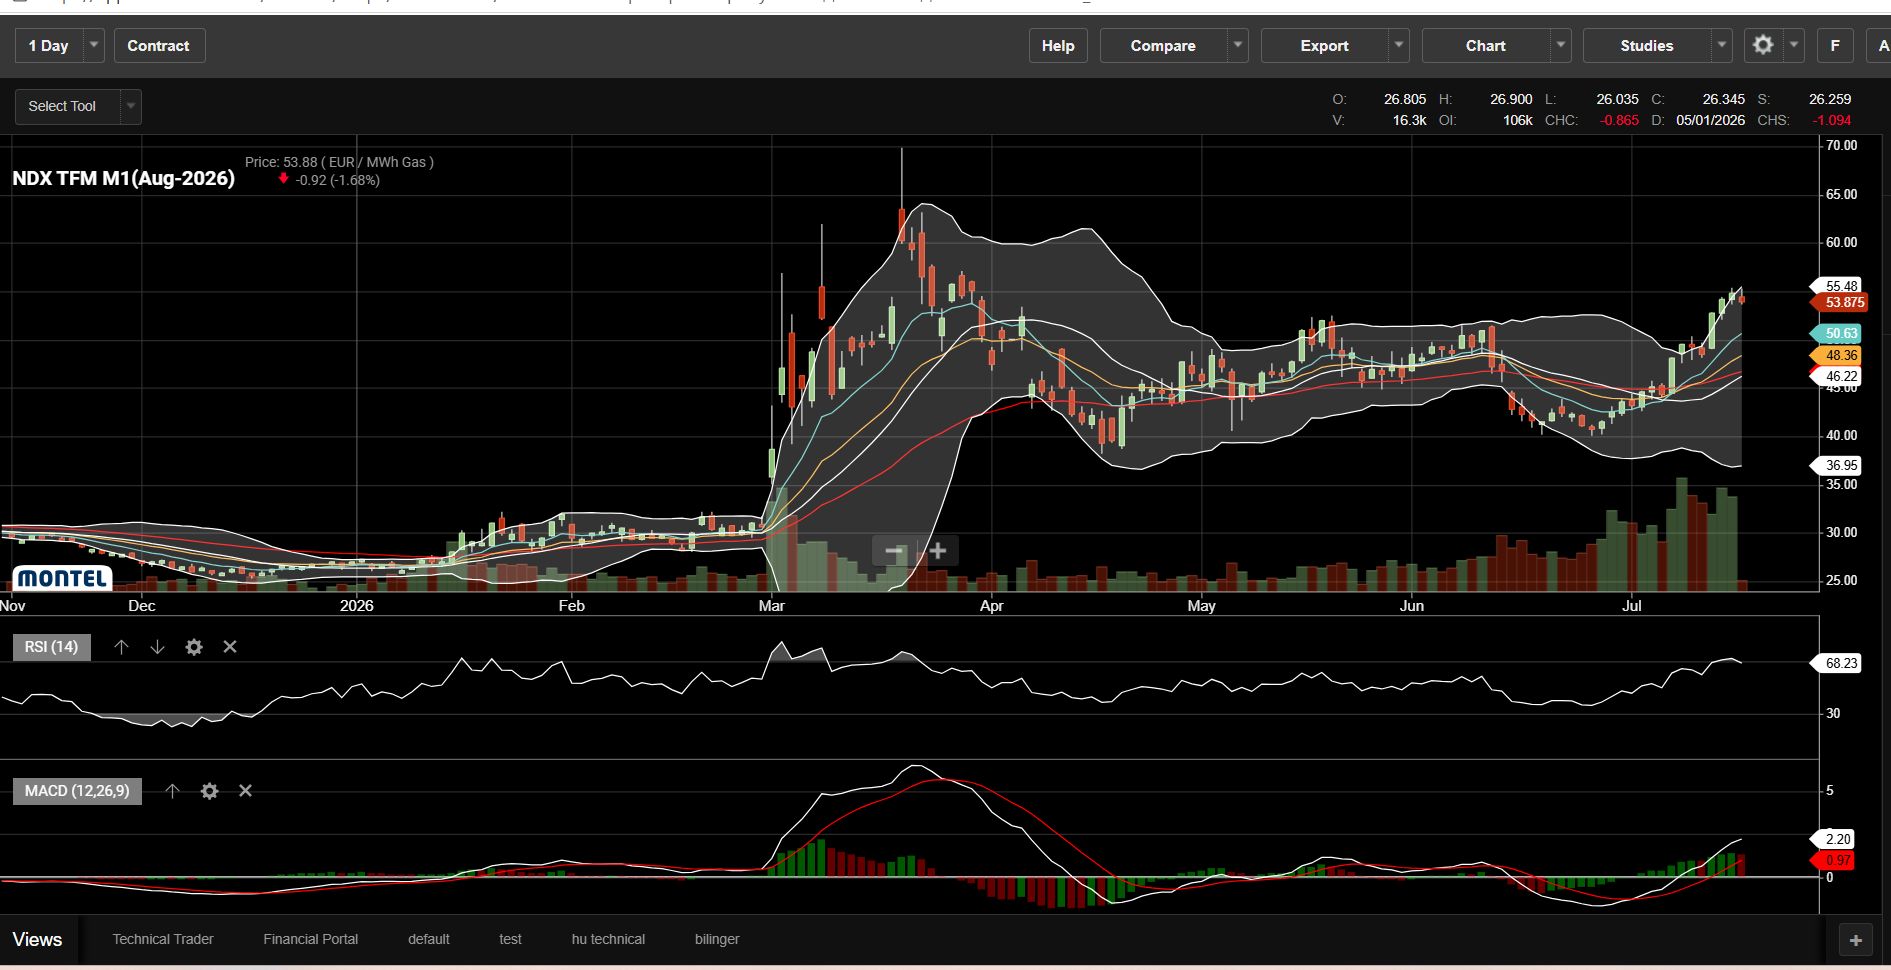
Technical indicators:
- The technical picture remains clearly bullish, although the market is approaching overbought territory in the short term.
- Prices remain above all key moving averages (~ €46.2, €48.4, €50.6/MWh).
- Short-term moving averages continue to slope sharply higher, confirming strong upward momentum.
- The early-July breakout was accompanied by a significant increase in trading volume, strengthening the validity of the move.
- Prices are trading close to the upper Bollinger Band.
- The Bollinger Bands continue to widen, typically signalling a strong trend.
- However, prices often experience a short-term consolidation after reaching the upper band.
RSI is around 68. This is close to overbought territory (>70), it reflects the strength of the current trend rather than signalling an imminent reversal. - MACD remains positive, with the MACD line still above the signal line. No bearish crossover has emerged so far.
Key support levels:
- €53/MWh – short-term breakout level
- €50.5/MWh – 20-day moving average
- €48–49/MWh – previous resistance, now acting as support
- €46/MWh – longer-term trend line
Key resistance levels:
- €55–56/MWh – first major upside target
- €58–60/MWh – March highs
Technical assessment
- The broader trend remains firmly upward.
- Momentum indicators continue to support higher prices.
- The rally has become increasingly stretched, raising the probability of a short-term correction.
The medium-term trend remains bullish, but after the sharp rally of recent days, the likelihood of a €2–5/MWh pullback has increased before another leg higher could develop.
Fundamental factors continue to support price levels. As a result, any near-term decline is more likely to represent a technical correction within an ongoing uptrend rather than the beginning of a broader bearish reversal.
Source: Montel Analytics, Reuters
Analysis written by: Tóth Eszter Lilla
16.07.2026